Slideshow
The Widgetkit Slideshow is the ultimate image and content slideshow for Joomla and WordPress. It’s flexible, easy to customize and completely built with HTML5 and CSS3.
Features
- Clean and very lightweight code
- 17 eye-catching transition effects
- Fully responsive including all effects
- Uses hardware accelerated CSS3 animations
- Supports HTML captions
- Swipe navigation on mobile devices
- Built with HTML5, CSS3, PHP 5.3+ and the latest jQuery version
- Works with Joomla and WordPress
Slideshow Screen Example
This is an image slideshow with the famous Ken Burns effect.
Slideshow Default Example
This is an image slideshow with eye-catching transition effects.
- All widgets are fully responsive
- Use shortcodes to show widgets anywhere
- Clean and lightweight code
- User friendly interface
- Supports touch gestures for mobile devices
- Built with the UIkit framework
Showcase Box Example
This a content showcase using all the features from the Slideset widget as a navigation. Any kind of HTML content can be used inside the navigation.
-
Case Study 1
A homeowner who had made a substantial investment in a solar system was dissatisfied with the savings in electricity costs and asking if the system was performing to its specified level. The solar contractor had shown the homeowner how to access the solar generation data online from the inverter OEM monitoring, but the homeowner had difficulty understanding the problem and was still very concerned.
Action:
The solar contractor suggested that the homeowner have the eLOK Monitoring and Efficiency system installed to provide the data to analyze the problem and recommend a solution. The granular, real-time data presented in easy-to-understand graphics via an online dashboard was acceptable to the homeowner.Results:
The system was installed in a couple of hours and the data quickly highlighted the problem.
The solar system was in fact over-performing and the problem was in a mismatch between when power was being generated and when the house was consuming maximum power. The return on the solar investment was not maximized because a lot of power was being backfed into the grid at a discount rate and the house was using a lot of power during high-price peak periods when solar was generating very little power. The homeowner quickly understood the charts and therefore the problem and asked the solar contractor to recommend a solution.
The solar contractor recommended a battery to store some of the excess solar power so that it could be used during peak periods to minimize demand charge penalties and therefore maximize savings. The battery would be modulated by the eLOK Battery Demand Control which is compatible with many battery systems. The data after these upgrades showed that the battery modulation allowed the battery to provide power through the whole peak period and the resulting bills were significantly lower.Statement:
A concerned customer was turned into a happy and satisfied customer.
The homeowner quickly saw the problem and it wasn’t the solar system.
The solar contractor was able to upsell a battery package.
The data shows that the homeowner’s ROI is increased substantially with a data driven solution. -
Case Study 2
A homeowner wants to minimize the demand charges he pays for his electricity during periods when the utility company uses peak demand pricing.
Action:
The homeowner’s energy contractor used Akida’s e-LOK Demand Control system to provide detailed data to help regulate the electricity demand during peak demand periods. The contractor configured the system using the utility company’s rate schedule to set the demand limits for the system. The homeowner identified the largest electrical loads that could be managed by the system and prioritized them for winter and summer. The contractor connected the loads to be managed to the e-LOK system and adjusted the settings based on feedback from the homeowner.Results:
The homeowner was impressed with the “set and forget” nature of the system and did not have to devote any time to manage and operate the energy savings function once it was configured. A difference was noticed in the utility bills immediately as the demand was managed to be at or near the limit set by the homeowner. Demand charges were minimized and the load prioritization resulted in a minimal impact to the livability in the home. Reviewing the data on the dashboard helped the homeowner become much smarter in their energy consumption to further reduce their costs.
The contractor was able to show how a specifically tailored solar system could further reduce electricity costs and have a very high ROI. The homeowner is happy that the e-LOK is able to continuously monitor electricity consumption and can be re-configured to allow for changes in utility rates and provide pro-active notifications of any maintenance needs for the equipment. Furthermore he approved the solar system because he knew he would be able to easily monitor his power generation while managing his consumption.Statement:
A homeowner’s very specific needs were met with an economic solution that put him in control.
The homeowner quickly saw how a solar system would create additional value and the contractor was able to upsell a solar package.
The data shows that the homeowner’s ROI is increased substantially with data driven demand control. -
Case Study 3
A homeowner who had a substantial solar and battery system was not happy with the savings and had asked another contractor what his options were to reduce his demand charges.
Action:
The contractor installed Akida’s e-LOK Battery Demand Control system to provide granular real-time data and modulate the power draw from the existing battery system.Results:
The contractor adjusted the system settings to different levels of grid power usage during the peak period to optimize the usage of stored solar power. The homeowner quickly saw an almost flat grid demand during the entire peak period with the battery lasting through the whole peak period and demand charges being held to a set limit.Statement:
A homeowner’s problem was solved economically and quickly.
The contractor was able to upsell an eLOK system on a package that he did not install, creating a new service line for him.
Showcase Button Example
This is an image slideshow with some nice navigation buttons. You can place any kind of HTML in the navigation buttons.
Tabs Example
This is a classic, tabbed slideshow. Tabs can be aligned to the left, right and center.
-
Data Sheet
.pdf download link will be here soon -
Installation Guideline
.pdf download link will be here soon -
Wiring Diagram
.pdf download link will be here soon -
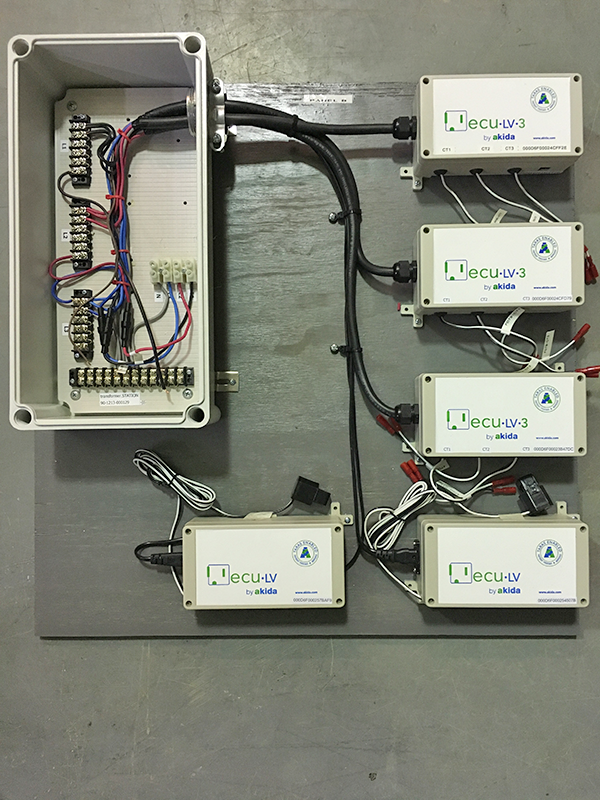
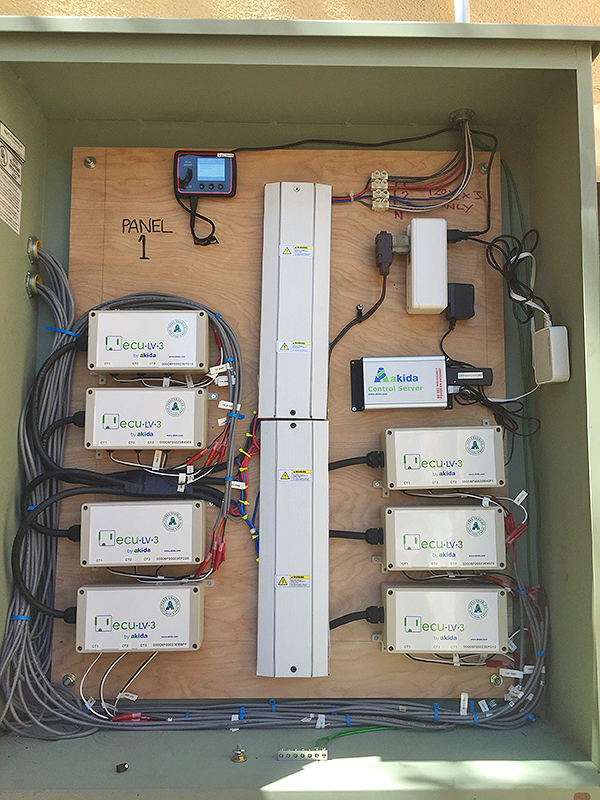
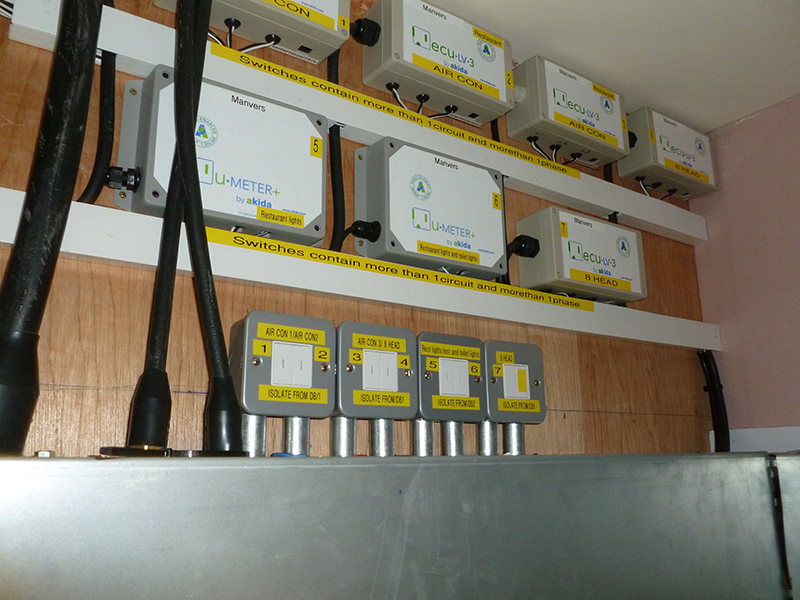
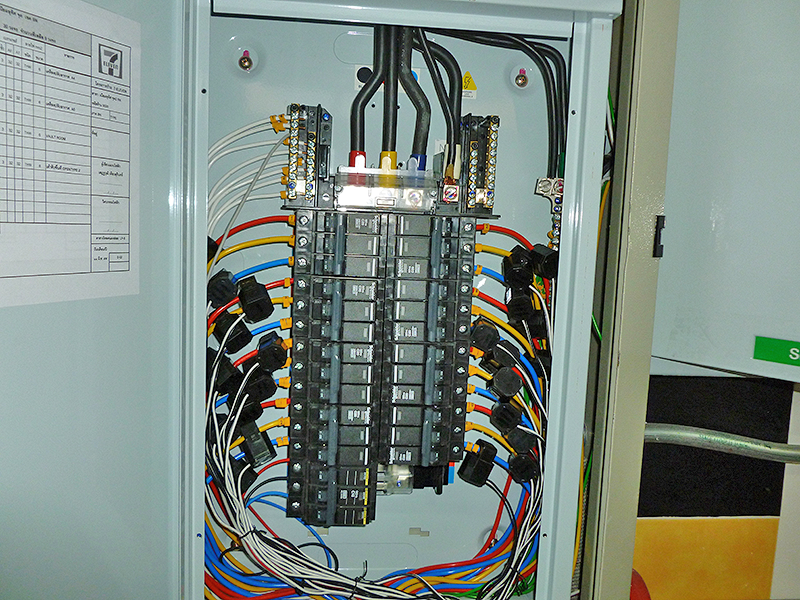
Installation Photos
Photos will be online soon.
Tabs Bar Example
This is a slideshow with a tabbed navigation bar. Tabs can be aligned to the left, right and center.
-
Data Sheet
.pdf download link will be here soon -
Installation Guideline
.pdf download link will be here soon -
Wiring Diagram
.pdf download link will be here soon -
Installation Photos


List Example
This is a slideshow with a vertical tabbed list as a navigation.
-
Data Sheet
.pdf download link will be here soon -
Installation Guideline
.pdf download link will be here soon -
Wiring Diagram
.pdf download link will be here soon -
Installation Photos
Photos will be online soon.
How To Use
The Widgetkit Slideshow takes full advantage of the very user-friendly Widgetkit administration user interface. It has never been easier to create and manage all the slideshows and their different slides in one place. After you created a slideshow you can load it anywhere in your theme using shortcodes or the universal Widgetkit Joomla module or WordPress widget.